
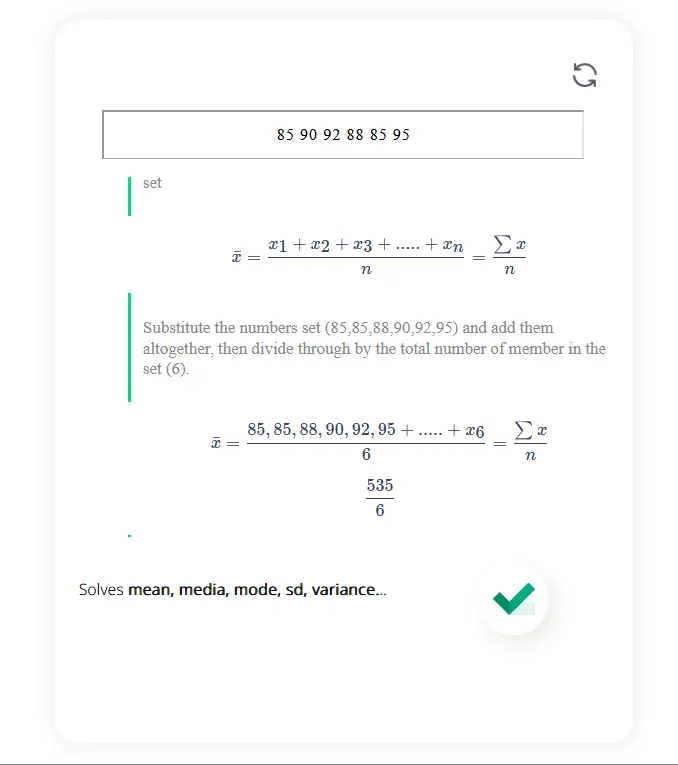
Solves mean, media, mode, sd, variance. .. \[\]
Enter your datasets separated by a SPACE
Calculate mean, media and mode of datasets with steps
Computes the standard deviation of a sample with step by by step worksheet
Calculates the coefficient of variation with steps.
Calculates range of data, coefficient of range, coefficient of media and mode.
Use this calculator to find the mean, median, mode, and standard deviation of data. It's super simple to use!
Want to know what the most common values are in your data? This calculator can help you find that out quick!
Need to calculate a lot of statistics? This handy tool is just what you need! It's simple to use, and it will save you time.
MathCrave statistics calculator calculate with clear step by step solution the following:
Mean: The mean is the average value of a set of numbers. It is found by adding up all the numbers in the set and dividing the sum by the total number of numbers.
Median: The median is the middle value in a set of numbers when the numbers are arranged in order. If there is an odd number of values, the median is the middle number. If there is an even number of values, the median is the average of the two middle numbers.
Mode: The mode is the most frequently occurring value in a set of numbers. A set can have no mode if all the values appear an equal number of times or if there is no repetition of values.
Standard Deviation: The standard deviation measures the dispersion or spread of a set of numbers. It tells us how far, on average, each value in the set is from the mean. A higher standard deviation indicates greater variability in the data.
Variance: The variance is the average of the squared differences from the mean. It is a measure of how much the values in a set differ from the mean.
Range: The range is the difference between the highest and lowest values in a set of numbers. It gives us an idea of the spread or variability of the data.
Coefficient of Range: The coefficient of range is the ratio of the range to the mean. It is a measure of relative variability.
Coefficient of Variation: The coefficient of variation is the ratio of the standard deviation to the mean. It is a measure of relative variability, taking into account the scale of the data.
Mean Deviation: The mean deviation is the average of the absolute differences between each value in a set and the mean. It is a measure of the average deviation from the mean.
Median Deviation: The median deviation is the average of the absolute differences between each value in a set and the median. It is a measure of the average deviation from the median.
Let's say we have a set of test scores: 85, 90, 92, 88, 85, 95
The mean is (85+90+92+88+85+95)/6 = 89.17
The median is the middle value, which is 88.
The mode is 85, as it appears twice in the set.
Step to calculate Standard Deviation:
1. Calculate the mean (μ) of the data set.
2. Subtract the mean from each value in the data set and square the result.
3. Calculate the mean of these squared differences.
4. Take the square root of the mean from step 3.
Step to calculate Variance:
1. Calculate the mean (μ) of the data set.
2. Subtract the mean from each value in the data set and square the result.
3. Calculate the mean of these squared differences.
Step to calculate Range:
1. Subtract the lowest value in the data set from the highest value.
Step to calculate Coefficient of Range:
1. Calculate the range.
2. Divide the range by the mean.
Step to calculate Coefficient of Variation:
1. Calculate the standard deviation.
2. Divide the standard deviation by the mean.
Step to calculate Mean Deviation:
1. Calculate the mean (μ) of the data set.
2. Subtract the mean from each value in the data set, take the absolute value of the result, and calculate the mean of these absolute differences.
Step to calculate Median Deviation:
1. Calculate the median of the data set.
2. Subtract the median from each value in the data set, take the absolute value of the result, and calculate the mean of these absolute differences.
This calculator provides you with accurate results and a clear understanding of the process. Input your data set, and the calculator will calculate the mean, differences from the mean, squared differences, variance, and finally, the standard deviation. With its step-by-step solution, you can easily follow along and grasp the concept of standard deviation, ensuring accurate and precise calculations every time.