
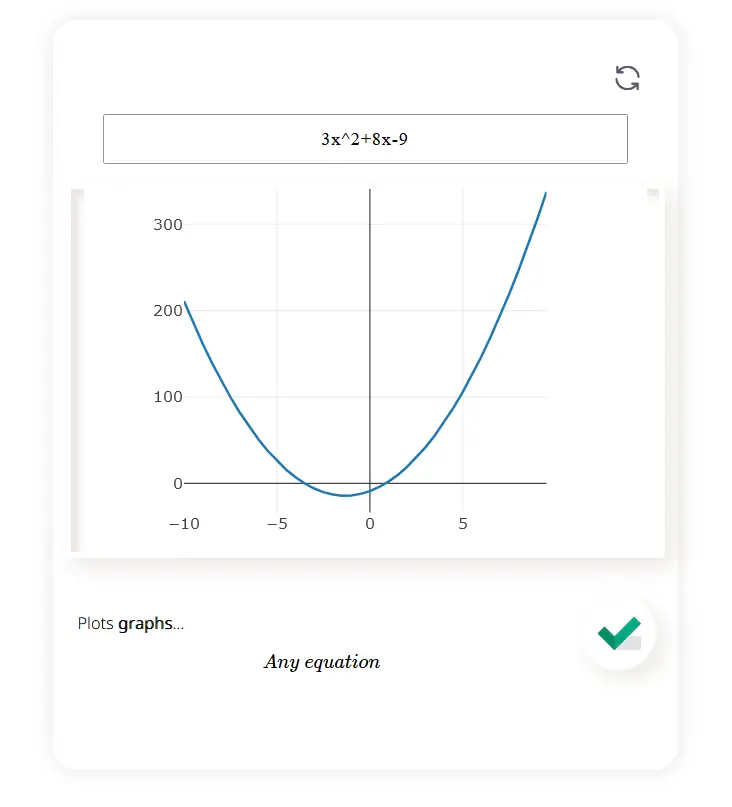
Plots graphs... \[Any \ equation \]
Here is a list of math topics that MathCrave graph plotter can plot
1. Functions and Graphs: This math topic explores the relationship between inputs and outputs, represented graphically. It includes concepts like domain, range, intercepts, and transformations.
2. Graphs Involving Linear Equations and Inequalities: It plots slope, point-slope form, slope-intercept form, and graphing linear inequalities.
3. Quadratic Equations and Functions: It focuses on equations and functions involving a squared variable. It includes concepts like vertex form, factoring, completing the square, and graphing parabolas.
4. Exponential and Logarithmic Functions: This module explores functions involving exponential growth or decay and the inverse relationship of logarithmic functions. It includes concepts like exponential growth/decay models, logarithmic properties, and graphing exponential and logarithmic functions.
5. Trigonometric Functions: This deals with functions involving angles and triangles. It includes concepts like sine, cosine, tangent, unit circle, and graphing trigonometric functions.
6. Polynomials and Rational Functions: It focuses on functions involving powers and fractions. It includes concepts like polynomial long division, synthetic division, finding zeros, and graphing polynomial and rational functions.
7. Conic Sections: This topic explores the shapes formed by intersecting a cone with a plane. It includes concepts like circles, ellipses, hyperbolas, and parabolas.
You need to correctly enter the expression, using the following examples
cos(3x)
sin(x) + cos(3x)
tan(x) + 4 * sin(2x)
Use following examples
3x^3 + 5x^2 -9x +3
12x^3 - 9x^2 +10x - 8
2x^(-3) - x^2 + 1/x - 8